Self-Healing Ops: Turn Repetitive Alerts into Closed-Loop Recovery
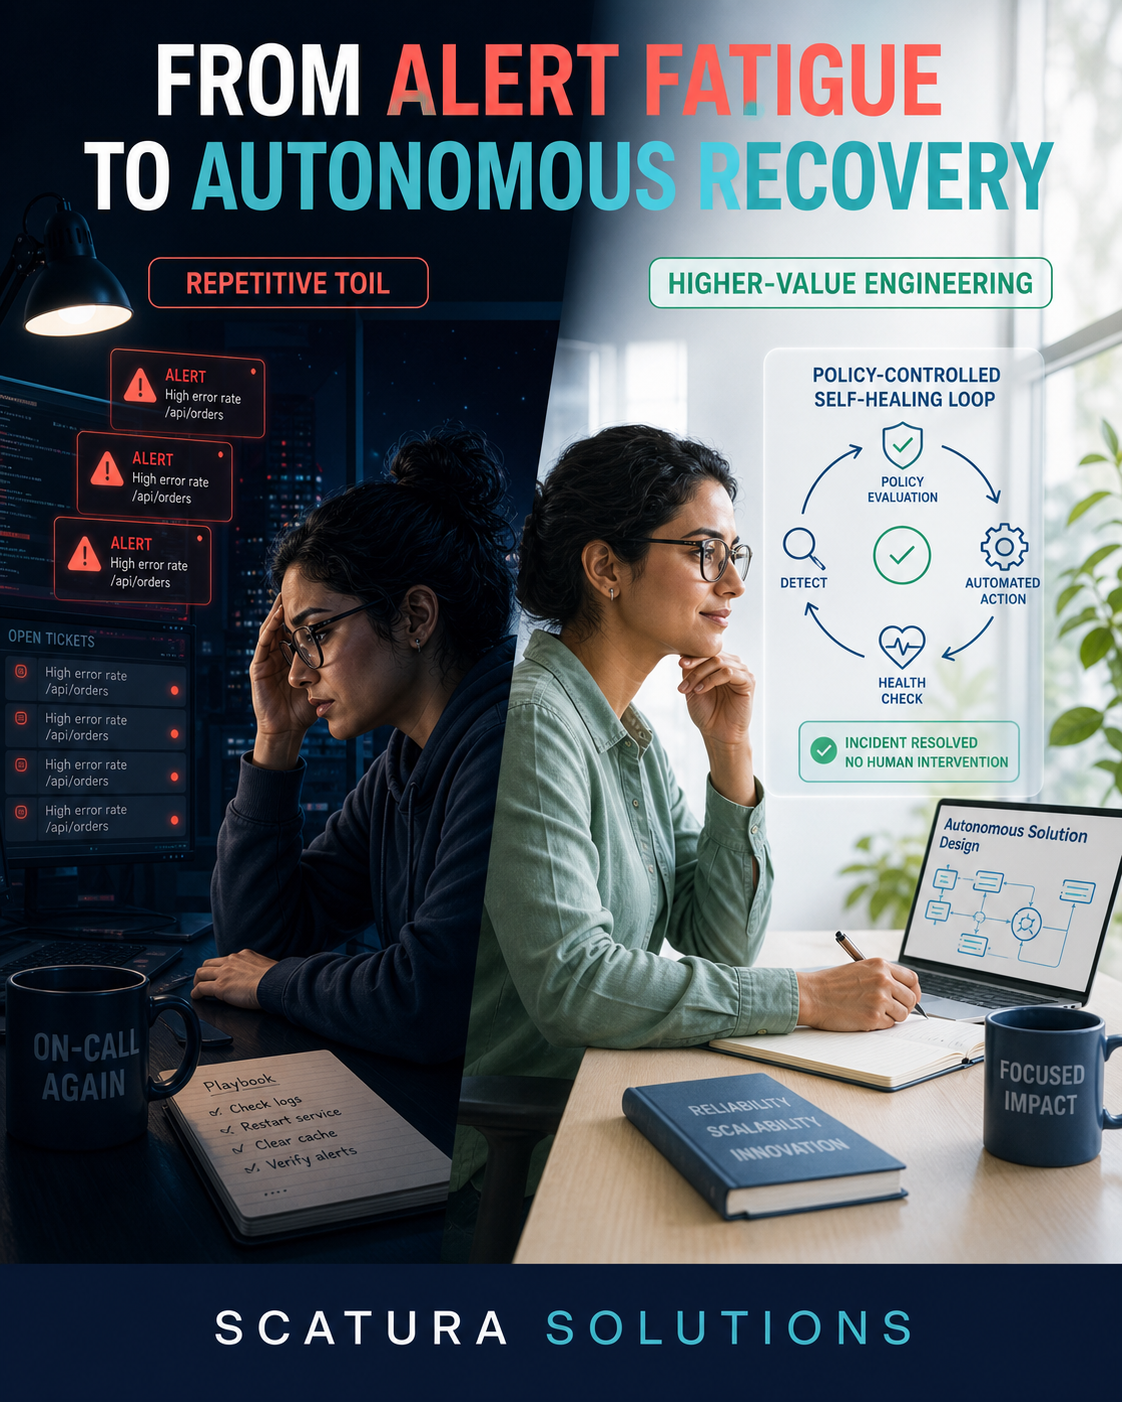
Repetitive alerts are a design smell
If the same alert keeps paging humans and the remediation is predictable, the issue isn’t “lack of engineers”—it’s lack of closure.
Many teams have already invested in:
- Monitoring/observability (Prometheus, CloudWatch, Datadog, Splunk, Elastic, Grafana)
- ITSM (ServiceNow, Jira Service Management) and integration layers (Workato, MuleSoft, Power Automate)
- DevOps automation (GitHub Actions, GitLab CI, Argo, Terraform, Ansible)
- Runbooks and tribal knowledge (wikis, SOPs, postmortems)
- AI/agentic capabilities (LLMs, AIOps correlation, summarisation)
Yet incidents often still follow the same loop:
Alert → engineer investigates → runs known fix → service recovers → ticket updated manually
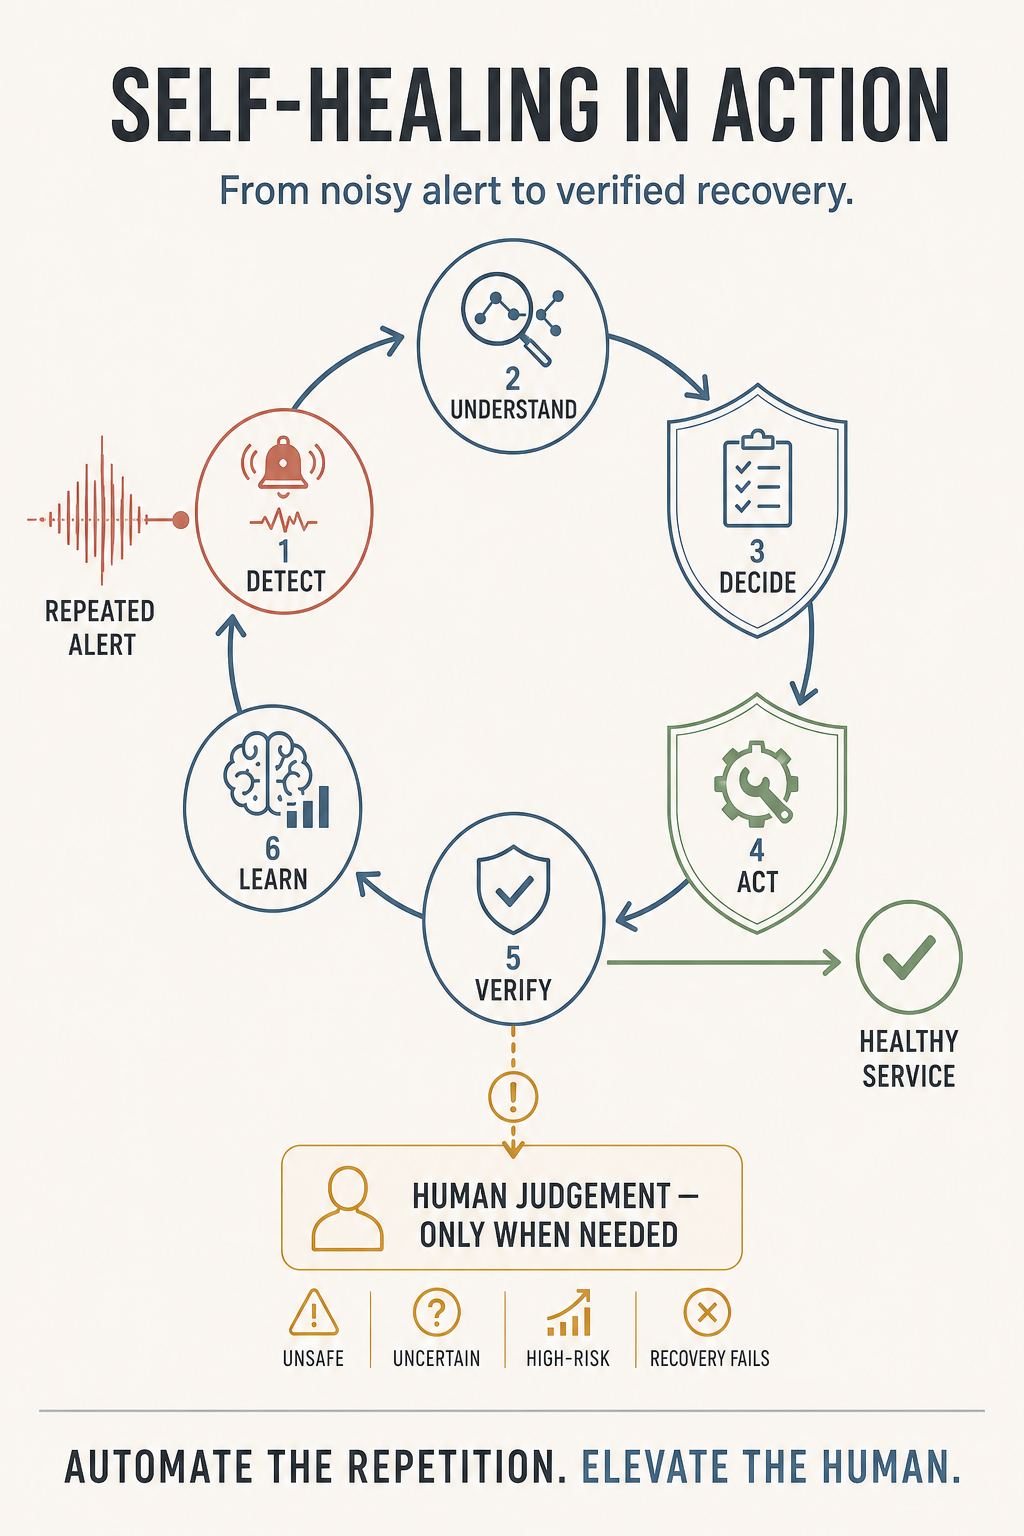
A self-healing approach doesn’t remove engineers from operations. It removes repetitive operational toil from engineers by connecting these components into a closed-loop system with guardrails, auditability, and verification.
The closed-loop model: from alerts to action
A useful way to think about self-healing is a pipeline with explicit gates:
- Detect and enrich the event
- Diagnose likely cause
- Select an approved remediation
- Execute with guardrails
- Verify recovery
- Update/close the ticket
- Escalate only when human judgement is required
The key is that the workflow must be:
- Policy-controlled (what is allowed, when, and under which conditions)
- Auditable (who/what changed what, and why)
- Reversible (rollbacks or compensating actions)
- Measurable (MTTR, false positives, success rate, toil reduction)
Step 1: Detect and enrich (make alerts actionable)
Most alert payloads are too thin: “CPU > 90%” is not a diagnosis.
Enrichment should add enough context for deterministic routing and safe automation:
- Service name, environment, ownership
- Deploy/version metadata
- Recent deploys or config changes
- Dependency health (DB, queue, downstream APIs)
- Impact signals (error rate, latency, saturation)
- Ticket history (is this recurring?)
- Known maintenance windows
A practical enrichment approach is to standardise an “event envelope” schema. For example:
{
  "event_id": "9d4f7c3a",
  "source": "prometheus",
  "service": "payments-api",
  "env": "prod",
  "severity": "high",
  "signal": {
    "name": "http_5xx_rate",
    "value": 0.12,
    "threshold": 0.05,
    "window": "5m"
  },
  "context": {
    "deployment": {
      "version": "1.28.3",
      "deployed_at": "2026-08-31T02:14:12Z"
    },
    "recent_changes": [
      {"type": "deploy", "id": "gh-9821", "time": "2026-08-31T02:14:12Z"}
    ],
    "dependencies": [
      {"name": "postgres-primary", "status": "degraded"},
      {"name": "redis-cache", "status": "ok"}
    ]
  }
}
This envelope becomes the contract between monitoring, automation, and ITSM.
Step 2: Diagnose (rules first, AI second)
Diagnosis in self-healing should be biased toward determinism and safety.
Start with simple correlation and rules that are easy to reason about:
- If 5xx spike + DB degraded → likely DB saturation or connection pool exhaustion
- If latency spike + no errors + CPU high → possible autoscaling lag or noisy neighbour
- If pod crash loop + recent deploy → likely regression; rollback candidate
AIOps/LLMs can help with:
- Summarising logs and traces
- Clustering similar incidents
- Suggesting likely causes based on past tickets/postmortems
But “suggesting” is not “acting.” Treat AI output as input into a governed decision, not an automatic executor—at least initially.
Step 3: Select an approved remediation (the “menu,” not a free-form agent)
Self-healing works best when remediation is an explicit, approved catalog of actions:
- Restart a deployment
- Scale a service (within bounds)
- Clear a stuck queue consumer
- Rotate credentials (rare, high risk; often human-gated)
- Fail over read replica
- Roll back last deploy
This is a runbook catalog with metadata:
| Remediation | Preconditions | Guardrails | Verification | Rollback |
|---|---|---|---|---|
| Restart deployment | Error rate high; no active incident | Max 1 restart/30m | Error rate normal within 10m | Escalate |
| Scale up | CPU > 85% for 10m | Max +2 replicas; only prod | CPU < 70% within 15m | Scale down after stability |
| Roll back | Incident started within 30m of deploy | Only last version; require change record | SLO burn rate improves | Re-deploy fix |
This “menu” approach prevents an agent from improvising risky actions.
Step 4: Execute within guardrails (policy as code)
Guardrails are what makes self-healing acceptable to reliability and security teams:
- Blast radius limits: only one service, one namespace, one region
- Rate limits: no flapping; max attempts per time window
- Change windows: no disruptive actions during freeze periods
- Approval gates: require human approval for high-risk actions
- Identity and audit: actions run as a controlled service identity with traceable logs
A lightweight way to model this is a policy evaluation step before execution. Example (pseudocode):
def allowed(action, event, history):
    if event["env"] != "prod":
        return True  # allow more in non-prod
    if action == "rollback" and not event["context"]["recent_changes"]:
        return False
    if history.count(action, within="30m") >= 1:
        return False
    if action == "scale" and event["service"] not in {"payments-api", "orders-api"}:
        return False
    return True
In mature setups, use a policy engine (e.g., OPA/Rego) to centralise and version-control these rules.
Step 5: Verify recovery (automation isn’t done until the service is healthy)
A common failure mode: automation runs the command, declares success, and walks away.
Self-healing requires outcome verification. Verification should rely on the same signals that matter to users:
- SLO burn rate
- Error rate/latency
- Synthetic checks
- Queue depth trending down
- Key business KPIs (where available)
Define explicit success criteria:
- “5xx < 1% for 10 minutes”
- “p95 latency < 300ms for 10 minutes”
- “No crashloop pods for 15 minutes”
If verification fails, the workflow should:
- Stop retrying after a bounded number of attempts
- Gather diagnostics (logs, traces, config diff)
- Escalate with context
Step 6: Update or close the ticket automatically (make it auditable)
Most orgs still need ITSM for compliance, audit, and reporting. Self-healing should integrate—not bypass.
A practical incident lifecycle:
- Create incident with enriched payload
- Add work notes as automation proceeds
- Attach evidence (graphs, log snippets, actions taken)
- Resolve automatically if verification passes
- Leave a linked post-incident record if recurring
Example: ticket work note template (generated automatically):
Self-heal workflow: payments-api-prod-http_5xx_rate
Diagnosis: probable DB saturation (postgres-primary degraded)
Action executed: scale payments-api from 6 → 8 replicas (policy: max +2)
Verification: 5xx rate 12% → 0.6% within 9m; p95 latency 820ms → 240ms
Result: recovered, monitoring stable for 15m
Next: investigate postgres-primary degradation (linked alert)
This is the difference between “automation” and “operationally acceptable automation.”
Step 7: Escalate only when humans add value
Escalation should happen when:
- The diagnosis confidence is low
- Guardrails block the action
- Verification fails
- The incident spans multiple services/domains
- There is a security or data integrity risk
When escalating, the system should provide a high-signal incident bundle:
- What happened, when, and impact
- What was attempted and why
- What evidence suggests the likely root cause
- What actions are recommended next
This reduces time-to-triage even when self-healing can’t fully resolve the incident.
A concrete example: “pod crash loop after deploy” auto-rollback
A classic “high-volume, low-risk” candidate (with appropriate constraints) is automatic rollback when a new version causes crash loops.
Signals
- Kubernetes
CrashLoopBackOffcount rising - Deploy occurred within last 30 minutes
- Error budget burn rate increasing
Remediation
- Roll back deployment to previous replica set
- Verify health checks and error rate
Workflow sketch
name: crashloop-auto-rollback
trigger:
  type: alert
  match:
    service: payments-api
    env: prod
    signal: k8s_crashloop_rate
guards:
  - within_minutes_of_deploy: 30
  - max_rollbacks_per_day: 1
  - require_no_active_major_incident: true
actions:
  - type: rollback_deployment
    target: payments-api
verification:
  - type: metric
    query: http_5xx_rate{service="payments-api",env="prod"}
    must_be_below: 0.01
    duration: 10m
itsm:
  incident:
    create: true
    resolve_on_success: true
    attach:
      - deploy_metadata
      - graphs
      - action_log
Even if your tooling differs, the pattern is consistent: trigger → guardrails → action → verify → record.
How to start without boiling the ocean
Pick one alert that is:
- High-volume (pages often)
- Low-risk remediation (restart, scale, clear cache)
- Easy to verify (clear success metric)
- Low blast radius (single service)
Then run it as an experiment with clear success criteria.
Suggested first candidates
- Restart a stuck consumer when queue depth rises and no messages are acknowledged
- Scale a stateless API when CPU saturation persists and error rate rises
- Rotate a failed pod by deleting it (letting the scheduler recreate) when node pressure is high
Measure outcomes (or you won’t scale it safely)
Track:
- Self-heal success rate (% resolved without human)
- MTTR reduction (before vs after)
- False heal rate (automation acted but shouldn’t have)
- Regression rate (issue recurs within X hours)
- Toil saved (pages avoided, hours reduced)
A simple reporting table per workflow helps drive governance:
| Workflow | Attempts | Success | Escalations | Avg time-to-recover | Notes |
|---|---|---|---|---|---|
| restart-consumer | 42 | 36 | 6 | 4m | 2 false positives due to bad alert threshold |
| scale-api | 18 | 17 | 1 | 6m | guardrails prevented runaway scaling |
| auto-rollback | 3 | 2 | 1 | 8m | 1 case was downstream DB issue, not deploy |
Where AI fits (and where it doesn’t)
AI is most valuable when it improves signal quality and decision support:
- Event enrichment from logs/traces
- Incident summarisation and clustering
- Suggesting likely remediations from past runbooks/tickets
- Generating draft ticket updates or post-incident summaries
AI is risky when it:
- Executes unbounded actions
- Bypasses policy checks
- Produces non-repeatable behaviour without auditability
A practical strategy is AI-assisted, policy-enforced automation: the model can recommend, but a deterministic policy gate decides what can run.
The operating model shift: engineers design systems that heal
Self-healing is a reliability design pattern, not a product feature. When you connect monitoring, automation, and ITSM into a verifiable closed loop, “alerts” stop being the primary unit of work. Outcomes do.
The payoff is not just fewer pages. It’s higher-quality operations:
- Faster, more consistent recovery
- Better audit trails and compliance evidence
- Less toil, more engineering time for resilience work
- A foundation for safer autonomy over time
Build one workflow. Prove it. Then scale what works.