
Break the 2:47am Incident Loop with Chaos Engineering
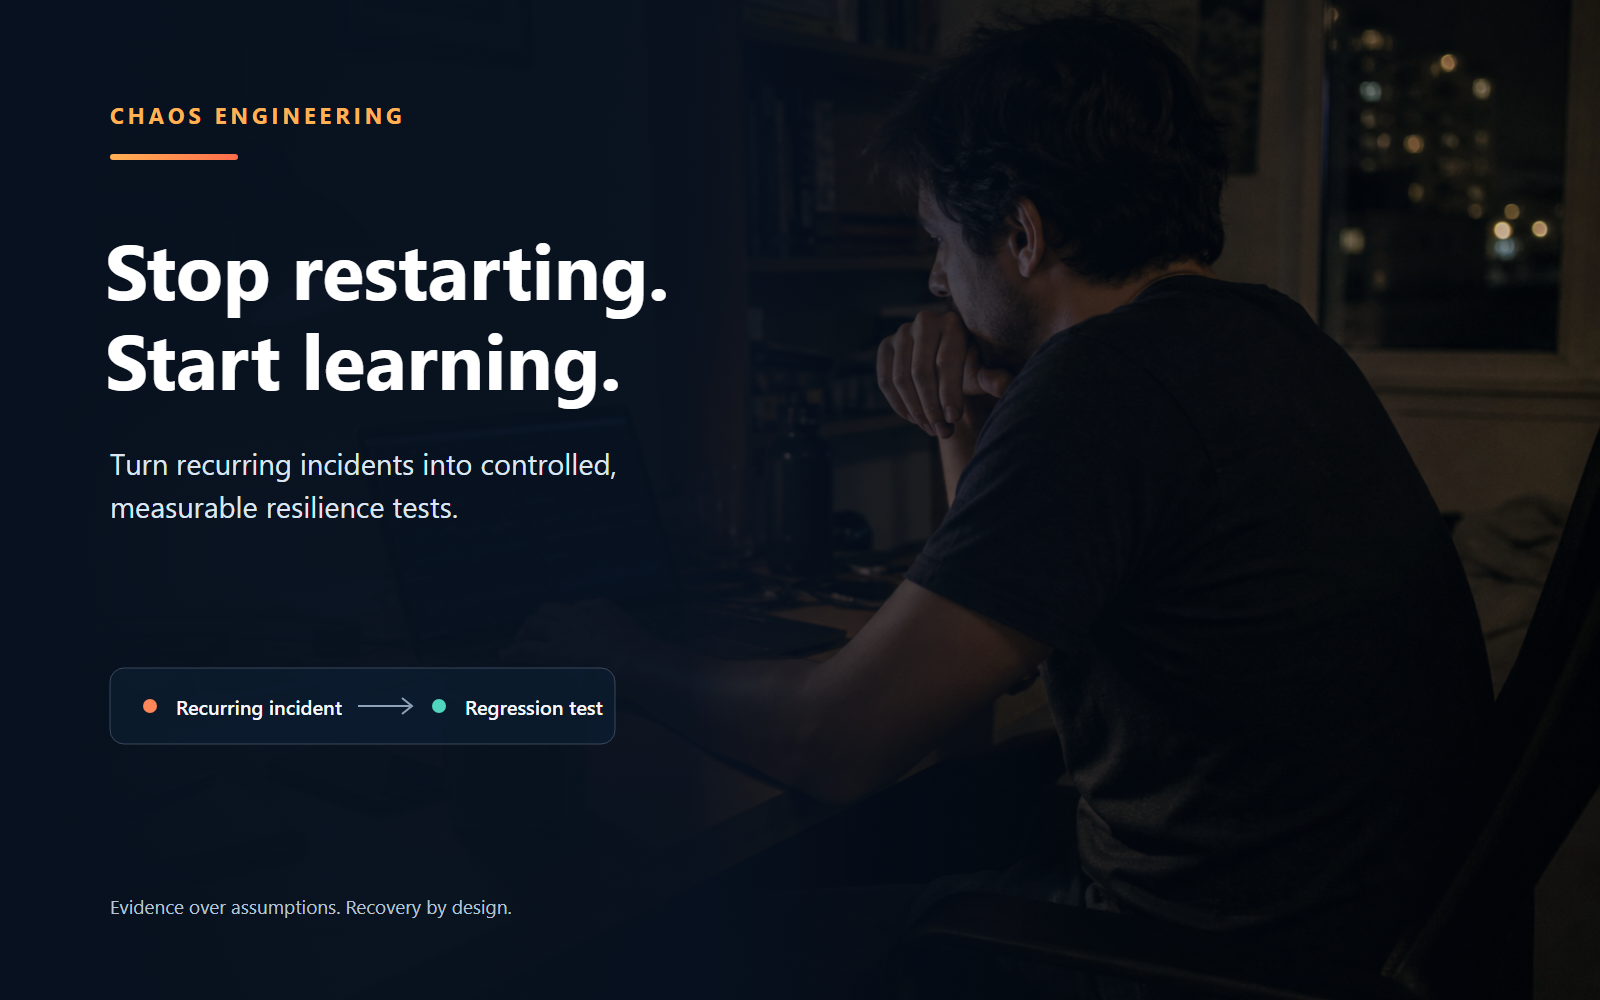
The most expensive incident is the one you keep having
Every team eventually inherits an incident that feels “solved” but keeps coming back:
- Pager goes off at 2:47am
- Someone restarts a service (or bumps replicas)
- Dashboards turn green
- Everyone goes back to bed
Then it happens again. Same alert, same runbook, same “fix.”
This loop is costly because it creates the illusion of control. If the restart clears the symptom, there’s no forcing function to answer the real question: why does the system require a restart to be healthy? Over time, you accumulate fragile services, “known flaky” dependencies, and tribal knowledge that only exists in late-night Slack threads.
Chaos engineering is designed to break this cycle, not by creating random outages, but by turning recurring unknowns into controlled experiments with measured outcomes.
Chaos engineering is not “breaking prod for fun”
A useful definition:
Chaos engineering is the practice of deliberately injecting controlled failures into a system to validate behavior against a hypothesis, using observability to measure whether it degrades safely.
The key words are controlled, hypothesis, and measured.
You’re not trying to “cause downtime.” You’re trying to answer questions like:
- If a dependency is slow or unreachable, do we fail fast or hang threads?
- Do retries amplify load and create a thundering herd?
- Do circuit breakers actually trip, or are they configured but unused?
- When pods get OOMKilled, do we recover cleanly or corrupt in-memory state?
- Under a traffic spike, do we autoscale in time - or does queue lag spiral?
These are the kinds of behaviors that are hard to infer from postmortems, because postmortems are often written under stress with incomplete data. Chaos experiments let you reproduce the failure on a Tuesday afternoon with full logging, traces, metrics, feature flags, and the ability to stop the experiment when safety thresholds are crossed.
The “2:47am patterns” chaos engineering exposes
Most recurring incidents map to a few common failure patterns. Chaos experiments are effective because they make these patterns deterministic and observable.
1) Retry storms (no jitter, no backoff)
A classic: dependency briefly slows down, clients retry immediately, traffic multiplies, and the dependency falls over completely.
What to look for
- Sharp increase in request rate to a downstream immediately after elevated latency
- CPU or connection saturation on both caller and callee
- Error budget burn rate spikes faster than the original latency increase would justify
Concrete fix
- Exponential backoff with jitter
- Limit retries to idempotent operations
- Apply a retry budget (cap retries as a fraction of baseline traffic)
Example retry policy in pseudo-code:
# Pseudocode
MAX_RETRIES = 3

for attempt in range(MAX_RETRIES):
    try:
        return call_dependency(timeout=250)  # ms
    except TimeoutError:
        sleep_ms = (2 ** attempt) * 50 + random(0, 50)  # exponential + jitter
        sleep(sleep_ms / 1000)
raise
Chaos experiment: inject 500–1500ms latency into the dependency and measure whether request volume multiplies or stays bounded.
2) Connection pool leaks → gradual latency collapse
“Works after restart” often means you reset something finite: file descriptors, sockets, threads, heap, or connection pools.
Symptoms
- Latency slowly increases over hours/days
- Increased
TIME_WAIT,CLOSE_WAIT, or pool wait time - Eventually requests hang, then time out, then restart “fixes” it
Chaos experiment: simulate dependency slowness and watch pool saturation signals:
- Pool in-use vs max
- Wait time
- Number of open connections
- Thread pool queue depth
If your service has a connection pool metric, make it a first-class SLO indicator.
3) Circuit breakers configured but not in the call path
This one is painful because the dashboards can show “circuit breaker is enabled” while the actual hot path bypasses it (e.g., direct HTTP client usage in one code path, or a different client library used by a background worker).
Chaos experiment: inject failures to the dependency and verify:
- breaker opens
- fallback executes
- upstream latency remains bounded
- user-visible behavior degrades gracefully
A measurable acceptance criterion might be:
- During dependency outage, p99 latency for user requests stays under 800ms
- Error rate rises no more than X% (because you serve cached or partial data)
- Thread pool saturation stays under 70%
4) Timeout mismatches → phantom resets
Common scenario:
- Your HTTP client timeout is 60s
- An upstream load balancer has idle timeout 30s
- At 30s, the LB resets the connection
- You see intermittent
ECONNRESETor “upstream closed connection” errors
Chaos experiment: inject a slow dependency and confirm timeouts fail before intermediate infrastructure gives up, and do so consistently.
A practical rule:
- Timeouts should be shorter than any known intermediate idle timeouts
- Apply timeouts at each hop (client, service-to-service, and internal calls)
5) Queue consumers that can’t shed load → backlog spiral
Queue-driven systems fail differently. If consumers can’t degrade (or scale) fast enough, lag grows, retries amplify, and downstream systems get hammered.
Chaos experiment: triple publish rate for 10 minutes and measure:
- queue lag / age of oldest message
- consumer processing rate
- DLQ rate
- downstream error rate
If autoscaling is based on CPU only, it often reacts too slowly; queue lag-based scaling is usually more predictive.
Convert unknown failures into test cases with hypotheses
A chaos experiment isn’t “kill a node and see what happens.” It’s:
- Define steady state (SLOs and key indicators)
- Choose a single failure mode
- Write a hypothesis
- Inject the fault with a limited blast radius
- Measure outcomes and decide pass/fail
- Record learnings as a regression test and an operational guardrail
Define steady state with concrete signals
Pick 3–6 indicators that represent user experience and system health. Examples:
- Availability: success rate ≥ 99.9%
- Latency: p99 ≤ 500ms for key endpoints
- Saturation: CPU < 75%, thread pool queue depth < N, GC pause < X
- Backpressure: queue lag < 60s, in-flight requests < cap
- Error budget: burn rate < 1x for the experiment duration
Steady state must be observable. If you can’t measure it, you can’t gate on it.
Write a real hypothesis
Bad: “System will be resilient to failures.”
Good: “If the payments provider returns timeouts for 2 minutes, checkout will degrade by showing ‘Try again’ within 800ms, retries will not exceed 1 per request, and we will not page.”
That hypothesis yields measurable acceptance criteria:
- latency bound
- retry rate bound
- alert behavior bound
Make chaos a release practice (pre-prod and canary), not an annual event
The biggest ROI comes from running small experiments often, not big ones rarely.
A practical release-integrated model:
- Pre-prod: run broader experiments to validate behaviors
- Canary in prod: run minimal blast-radius tests against a small slice of traffic
- Promotion gate: if steady-state deviates beyond thresholds, stop promotion
Example: chaos gate in a deployment pipeline
Even without adopting a full chaos platform, you can build a “chaos gate” conceptually:
- Deploy canary (5% traffic)
- Inject one fault (e.g., 1% packet loss to dependency, or 500ms latency)
- Observe for 10 minutes
- Auto-promote only if metrics remain within thresholds
At minimum, store experiment runs alongside release artifacts so you can correlate “release X passed chaos experiment Y.”
Kubernetes example: inject a controlled OOM and validate recovery
One of the most “restart fixes it” patterns in Kubernetes is an OOMKilled pod that recovers but causes cascading failures while it flaps.
A controlled experiment can be as simple as deliberately applying memory pressure to a canary deployment and checking whether:
- requests drain correctly (readiness/liveness)
- downstream timeouts don’t amplify
- the system maintains p99 latency bounds
If you use a chaos tool (e.g., Chaos Mesh or Litmus), you can codify this. A conceptual example (tool-agnostic):
- Target:
checkoutcanary pods only (label selector) - Fault: memory stress to exceed limit and trigger OOMKill
- Safety: abort if 5xx > 2% or p99 > 1s for 2 minutes
- Expected: pod restarts, readiness prevents traffic routing until warm, error rate stays under threshold
Even if you don’t implement the YAML today, the important part is the contract:
- what failure is injected
- what “good” looks like
- when to stop
Observability: measure what the postmortem guessed
Recurring incidents are often “explained” with plausible narratives that don’t survive measurement. Chaos experiments force measurement.
During experiments, prioritize:
- Distributed tracing: confirm where time is spent, identify retries, see fan-out
- Golden signals: latency, traffic, errors, saturation
- Resource signals: CPU steal, throttling, memory RSS, GC pauses, thread pool exhaustion
- Dependency metrics: connection pool utilization, DNS query failures, cache hit rate
- Alert quality: did the alert fire? was it actionable? did it page the right people?
One useful output is an “experiment scorecard” (pass/fail + observed deltas). Over time, you build a library of failure modes that “must never page again.”
Disaster recovery: stop doing confidence theater
Annual DR tests often prove only that people can follow a checklist under ideal conditions. They rarely produce repeatable, time-series evidence of actual RTO/RPO.
Continuous, limited failover experiments can:
- Measure RPO from actual replication lag at the moment of failover
- Measure RTO from actual client-observed errors and recovery time
- Verify DNS/traffic shifting works as expected
- Verify that dependent systems (secrets, queues, third-party integrations) behave during cutover
The difference is repeatability: you’re not trusting a once-a-year snapshot. You’re collecting proof every run.
Tooling has caught up, now the practice matters
Azure Chaos Studio and AWS Fault Injection Service made chaos engineering easier to adopt in managed environments. Kubernetes ecosystems have mature options as well. But the tool is not the strategy.
The strategy is:
- small blast radius
- one fault at a time
- hypotheses and gates
- measurable steady state
- captured outcomes as regression tests and operational requirements
A practical starting point: pick your “that incident” and design one experiment
If your team has a runbook that starts with “restart the service,” that’s a prime candidate. Start with one recurring incident and design a single, safe experiment:
- Pick the failure mode you suspect (timeout, DNS NXDOMAIN, packet loss, OOMKill, node termination)
- Define steady-state SLOs (success rate, p99, queue lag, saturation)
- Write a hypothesis about what should happen
- Limit blast radius (canary only, single AZ, one service, short duration)
- Add abort conditions (error rate, latency thresholds)
- Run it during business hours with the right people watching
- Turn the results into action: code fixes, config changes, and a regression experiment
When you do this consistently, the 2:47am incident stops being a ritual. It becomes a closed loop: failure mode → experiment → fix → regression guardrail.
And the best outcome isn’t “we survived the chaos test.” It’s simpler:
The next time that dependency fails, it’s boring and nobody gets paged.